Problem 1: Negative autoregulation
Consider the two simple circuits shown below (adapted from Del Vecchio and Murray, Biomolecular Feedback Systems, Figure 2.7), where A is an arbitrary repressor (it could be, e.g., LacI).
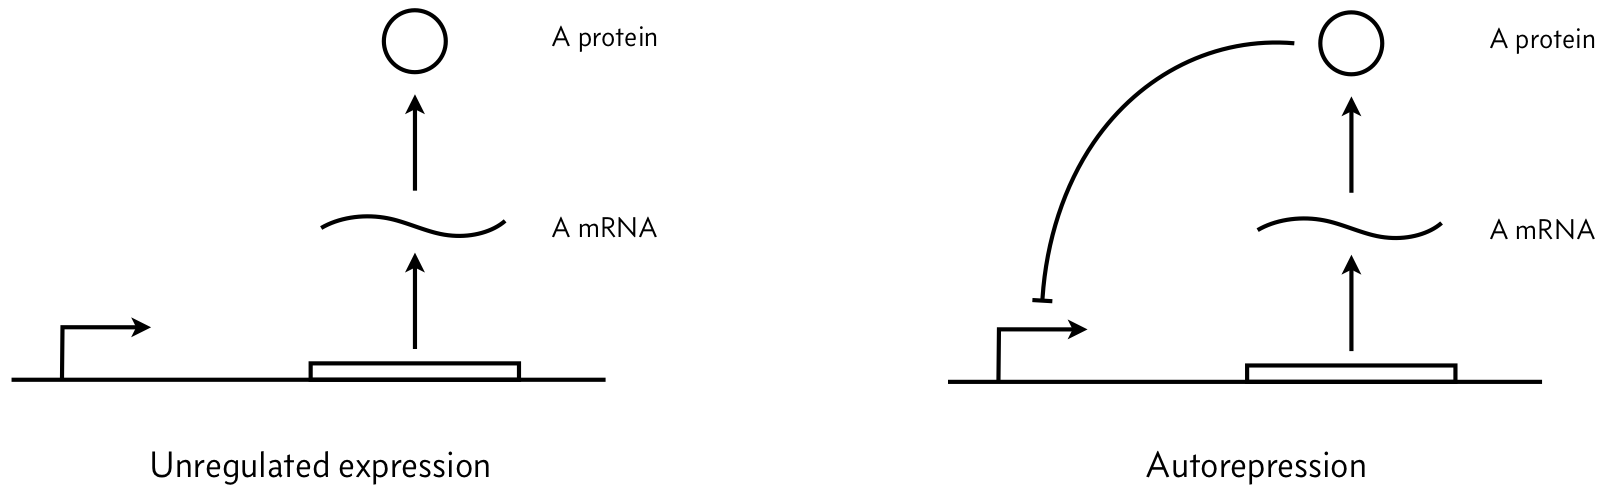
We parametrize the dynamics as follows. Let $\beta_m$ be the unregulated mRNA production rate, $\gamma_m$ be the mRNA degradation rate constant, $\beta_p$ be the protein production rate constant, and $\gamma_p$ be the protein degradation rate constant.
a) Assuming mass action kinetics, write down mathematical expressions in the form of a system of coupled ODEs for the left figure (unregulated expression). Assume that this system exhibits no leakiness.
Show hint
- Use mass-action kinetics for mRNA and protein production/degradation.
- Write coupled ODEs: $$\frac{dm}{dt} = \beta_m - \gamma_m m$$ $$\frac{dp}{dt} = \beta_p m - \gamma_p p$$
- Think of mRNA as produced at a constant rate and degraded proportionally to its concentration; same for protein.
b) Find the steady state mRNA concentration, $m_0$, and the steady state protein concentration, $p_0$, in terms of the given parameters.
Show hint
- Set derivatives to zero: $$0 = \beta_m - \gamma_m m_0 \implies m_0 = \frac{\beta_m}{\gamma_m}$$ $$0 = \beta_p m_0 - \gamma_p p_0 \implies p_0 = \frac{\beta_p m_0}{\gamma_p}$$
c) Now write down mathematical expressions in the form of a system of coupled ODEs for the right figure (negatively autoregulated expression). Assume that repression serves to decrease the mRNA production rate by a factor of $1/(1 + (p/k)^n)$, where $p$ is the protein concentration. This is a repressive Hill function with Hill coefficient $n$ and activation constant $k$. Again, assume that this system exhibits no leakiness.
Show hint
Multiply the constant $\beta_m$ in the ODE by an repressing Hill function: $\frac{1}{1 + (p/k)^n}$. Think: as protein increases, mRNA production decreases.
d) One of the ways we quantify the separation of time scales is by evaluating the ratio $\gamma = \gamma_p/\gamma_m$. Provide an argument why we may neglect the mRNA dynamics and consider only the protein if $\gamma \ll 1$.
Show hint
e) Assume we initially have no mRNA or protein present. Suddenly, a cell needs to start producing the protein, so the gene is turned on at time $t = 0$. Starting from initial conditions of $m(0) = p(0) = 0$, solve the ODEs (numerically or otherwise) for both the unregulated and autoregulated systems. You should choose parameters as would be typical for a bacterial cell. The excellent BioNumbers website will be helpful. Plot the respective dimensionless mRNA and protein concentrations over time. Comment on the nature of the responses of the unregulated versus regulated circuit. Which has a faster response? How long does it take each to get to steady state?
Show hint
Problem 2: Autoactivation, bistability, and the importance of leakage
In this problem, we will explore a very simple circuit: autoactivation of a single gene, shown in the figure below. We will assume a separation of time scales in mRNA and protein degradation/dilution such that we only need to consider the dynamics of the protein, and we will call its concentration $x$. We will further assume that the autoactivation effect can be modeled as a Hill function with Hill coefficient $n$.
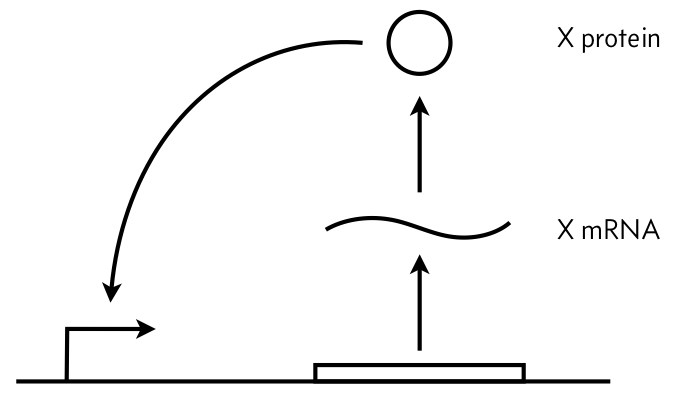
a) Write down an ODE describing the dynamics of $x$. Include leakage parametrized by $\alpha$.
Show hint
b) Show that for $n = 1$, only one steady state exists for $\alpha > 0$. Show further that when $\alpha = 0$, two steady states may exist, but only one is stable.
Show hint
c) In part (b), we considered the case where activation is not cooperative. We now consider the other extreme, where activation is infinitely cooperative. Derive the condition for bistability when $n\to\infty$. In other words, for what parameter values does the circuit exhibit two stable steady states? Discuss this condition as it relates to design principles for bistability.
Show hint
Problem 3: Bioproduction
Question.
We are given the growth curve of Escherichia coli in a 1L bioreactor over 20h (Fig. 4 in [1]). The goal is to provide a simple model of the population growth.
Details.
The model must only cover a simple growth behavior of the E. coli population that reasonably well fits the growth data in Fig. 4 - it should be as simple as possible. In particular it can neglect IPTG induction, O2, kanamycin, and the production of HA1, among many other effects.
Subquestions.
Propose a Chemical Reaction Network (CRN) model for a growth process and discuss your design decisions. The CRN model can assume that all reactions are of the form
A + B -> C + D [$\gamma$]
with A, B, C, and D also potentially being absent from the reaction and the rection rate being $\gamma * [A] * [B]$ (mass action kinetics). Discuss how you match the model outputs (e.g. counts/mL) to the OD in Fig. 4.
Code & simulate your model in Python MobsPy [2] for realistic but guessed parameters in your model.
Find optimised model parameters with Python
scipy.optimize(or a similar library) and plot an overlay of the measured curve in Fig. 4 and your model output.
[1] https://www.researchsquare.com/article/rs-16009/v1
[2] https://github.com/ROBACON/mobspy
License & Attribution: This page is adapted from material by Michael Elowitz and Justin Bois (© 2021–2025), licensed under CC BY-NC-SA 4.0.